Traffic you can turn up
Steady, bursty, diurnal or a spike. One slider multiplies every client while you watch.
System design simulator · private beta
Draw your architecture, run real traffic through it, and see throughput, latency and failures, component by component, as they happen. All in the browser.
How it works
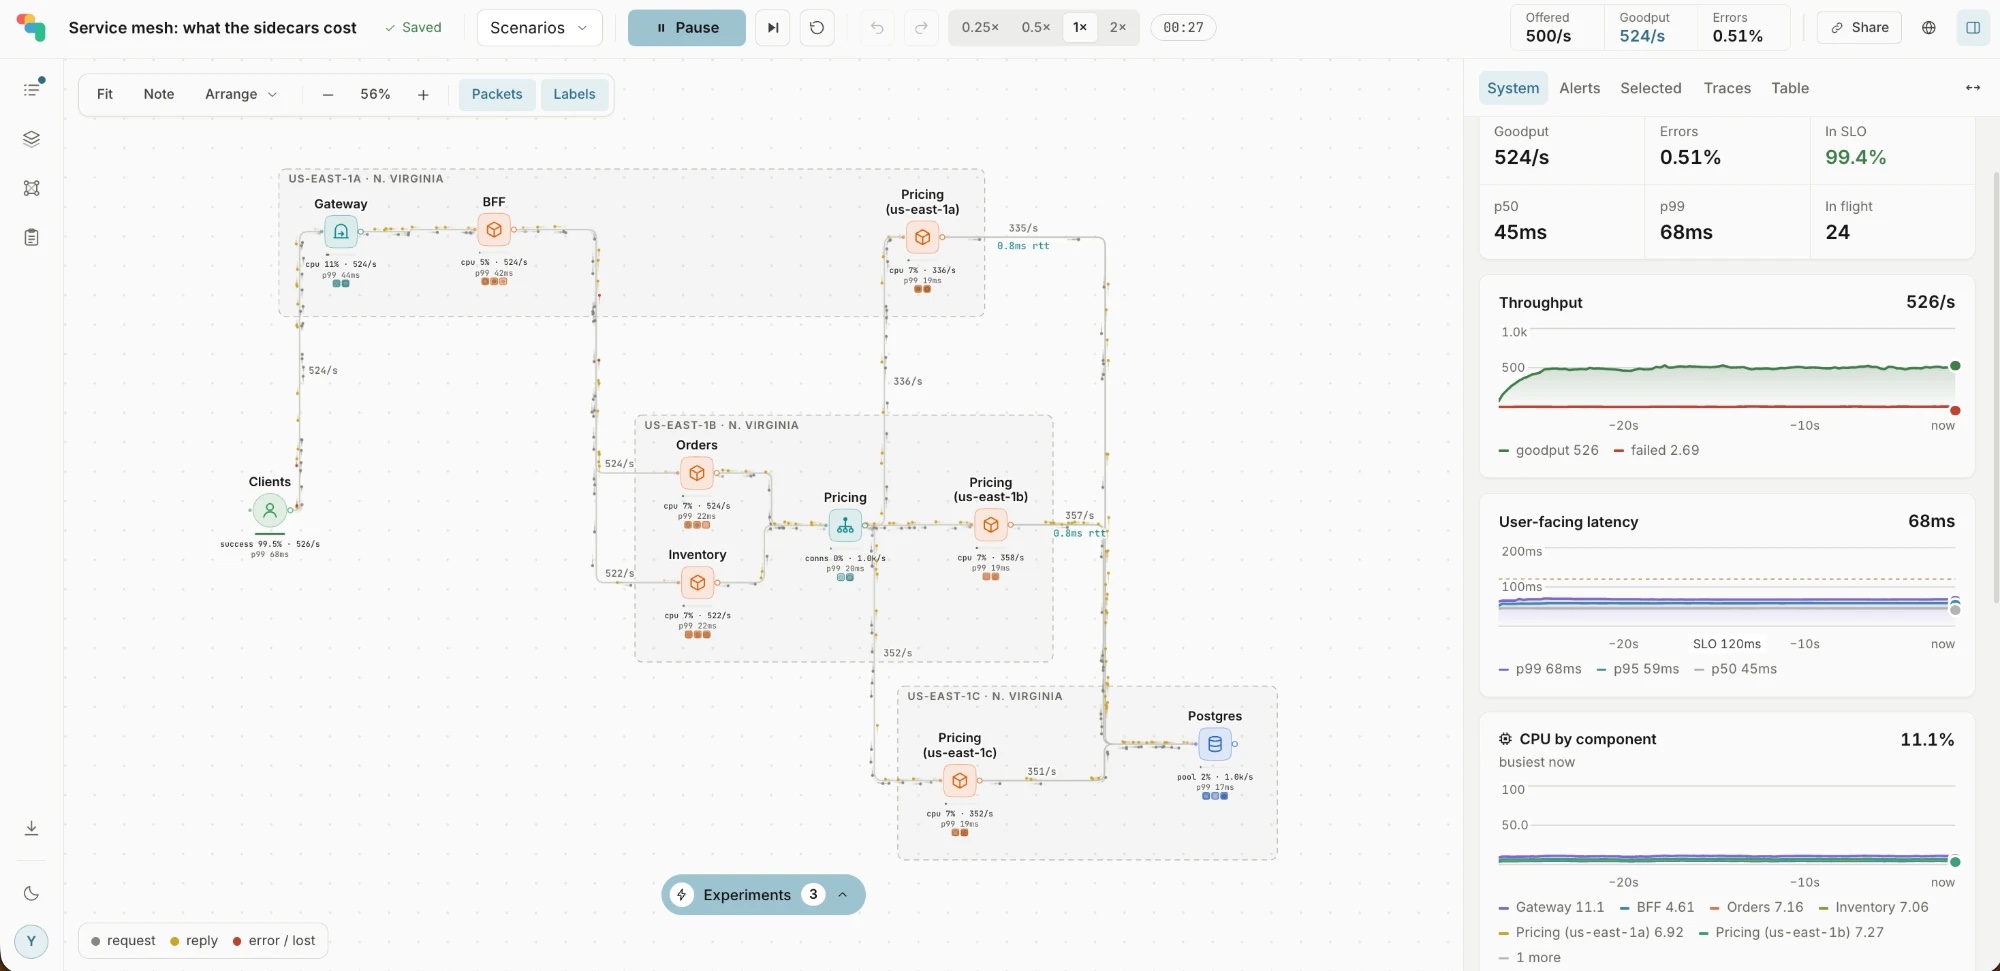
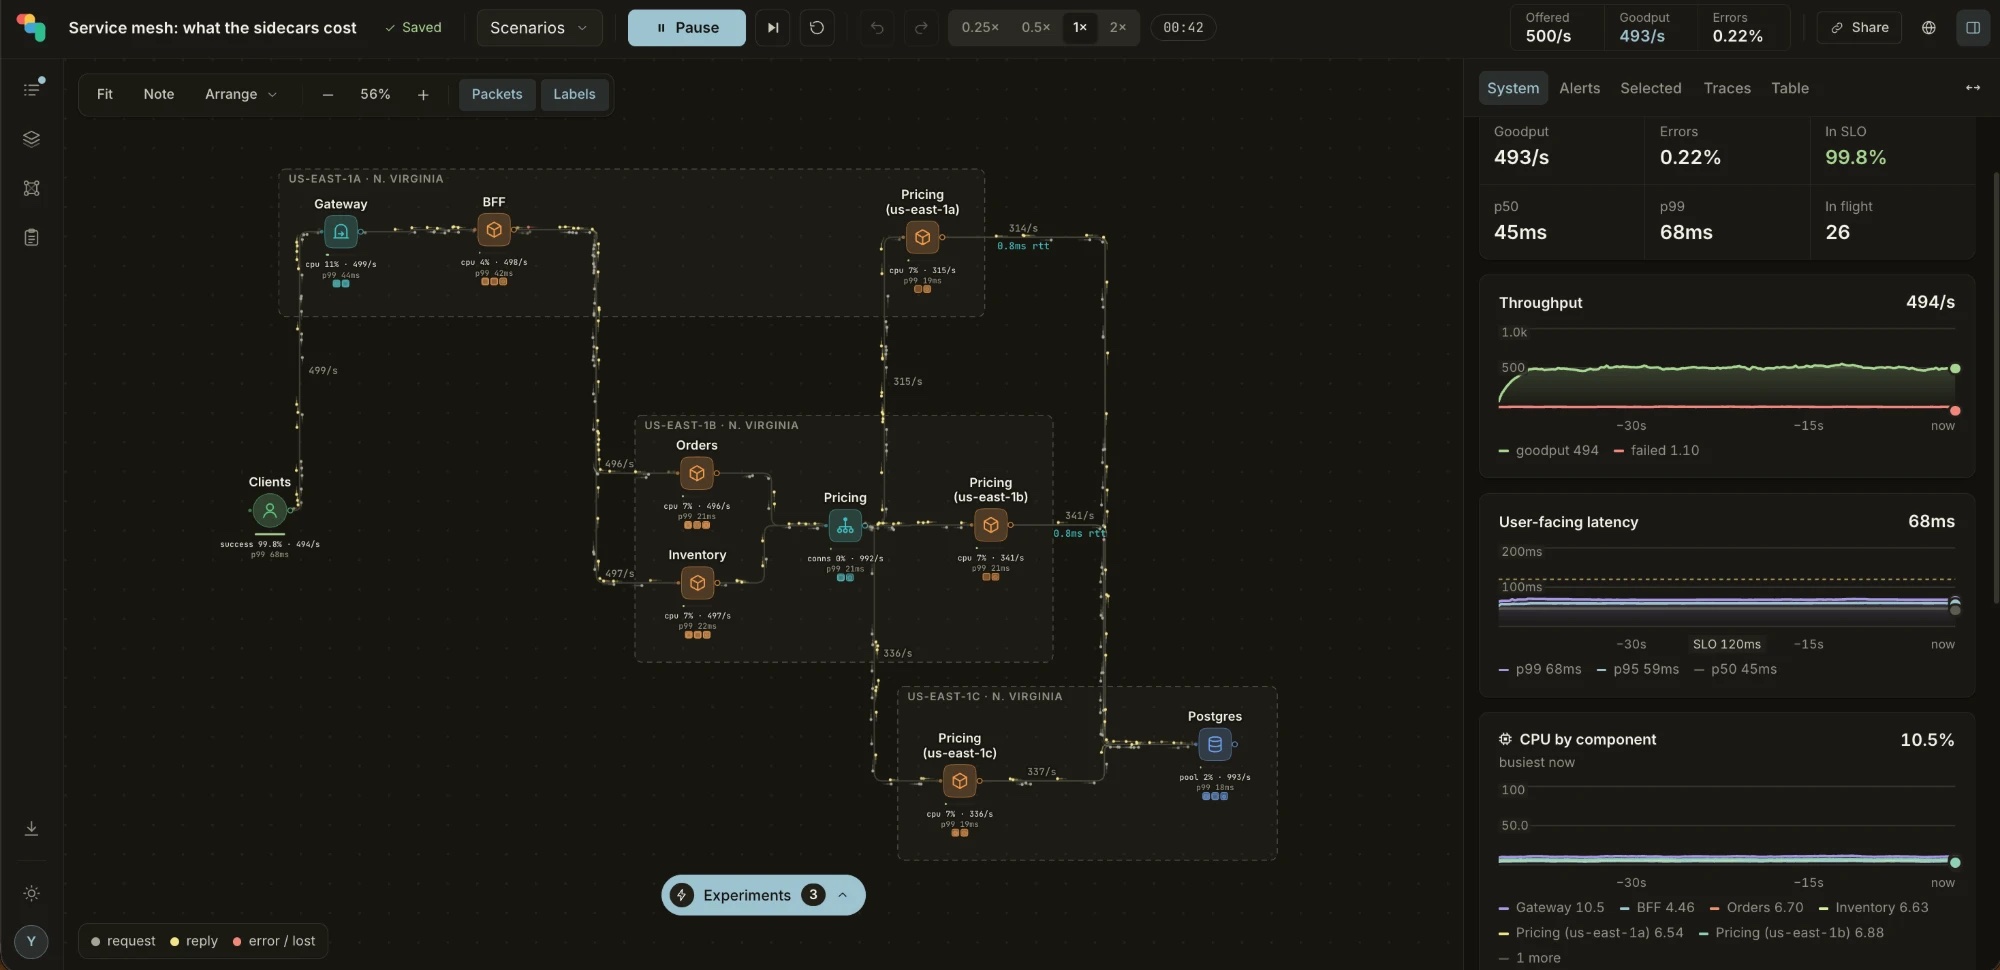
Drop load balancers, services, caches, queues, databases and CDNs on a canvas and connect them, or start from one of 77 designs, from a three-tier app to a global ride-hailing platform.
Press play and traffic flows. Every request is simulated, with its path, its latency and where it waits. Turn the traffic up from a quiet night to ten times launch day.
Kill a replica, slow a database, lose a zone, or replay a real outage. Alerts fire, the timeline fills, and each component tells you why it gave way.
What is inside
Steady, bursty, diurnal or a spike. One slider multiplies every client while you watch.
Inject slowdowns, errors, crashes and partitions, or replay well-known outages step by step.
Every component explains its ceiling: Little’s law, queueing, pool sizes, what it waits on.
Place components in real regions; a cross-zone or cross-ocean hop costs what it really costs.
Spot the missing rate limit, the single point of failure, the retry storm waiting to happen.
How many times today’s load it survives, which component gives out first, and what it would cost.
Read the numbers
Select any component and it shows its theoretical ceiling, what it is offered now, the queueing behind it and what each request waits on. A service at 86% stops being a mystery: its connection pool is the limit, and you can see what doubling it would buy.
Twenty connections, twenty requests in flight: the pool is the limit. Raise it, or make each query faster.
See it the way on-call does
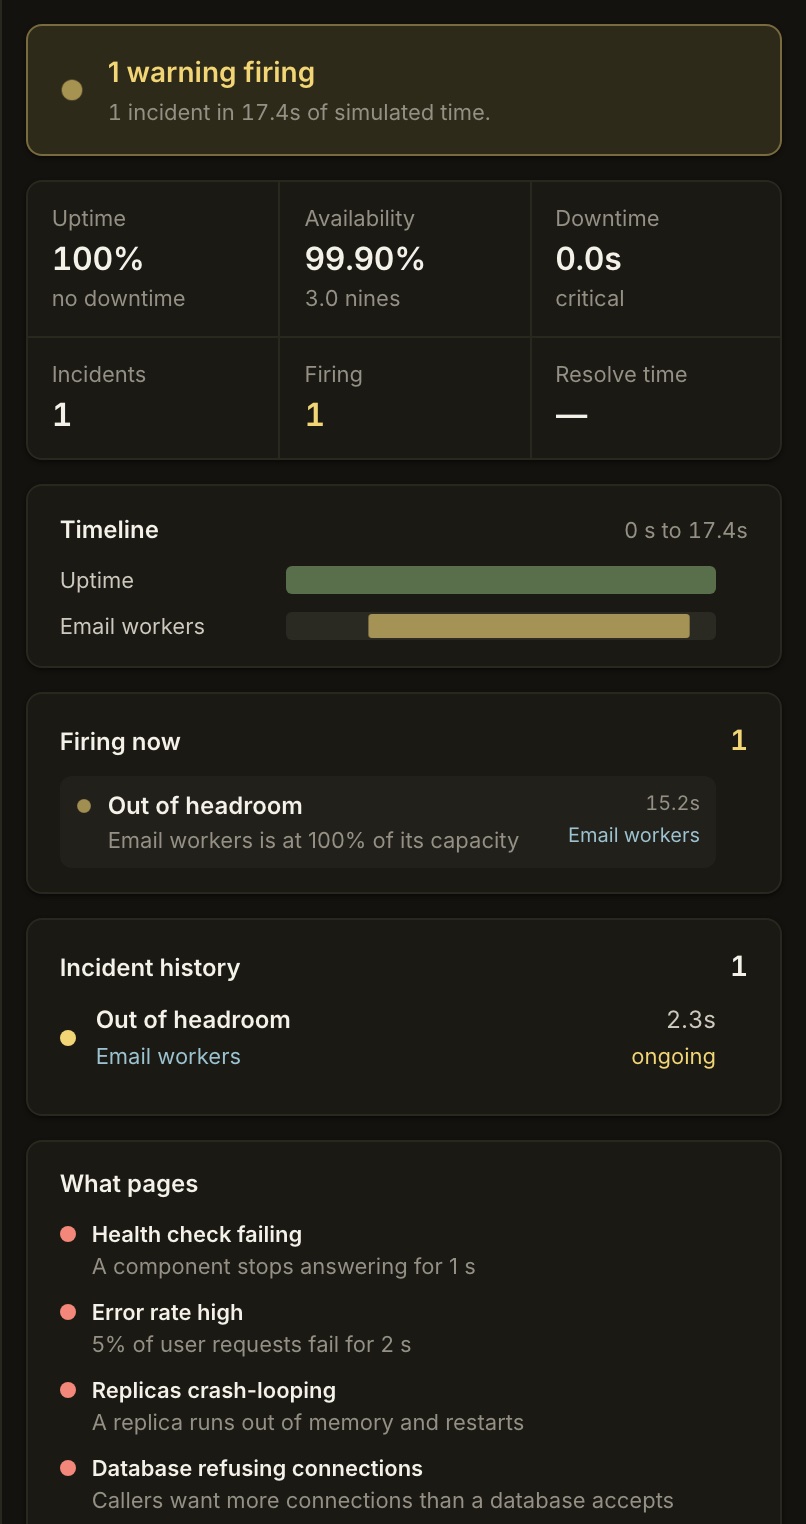
The rules a pager would use: error rate, saturation, health checks, disk, deadlocks, circuit breakers. A condition has to hold before it fires, so one bad sample never wakes anyone, and every incident lands on a timeline you can read afterwards.
From three boxes to a whole platform
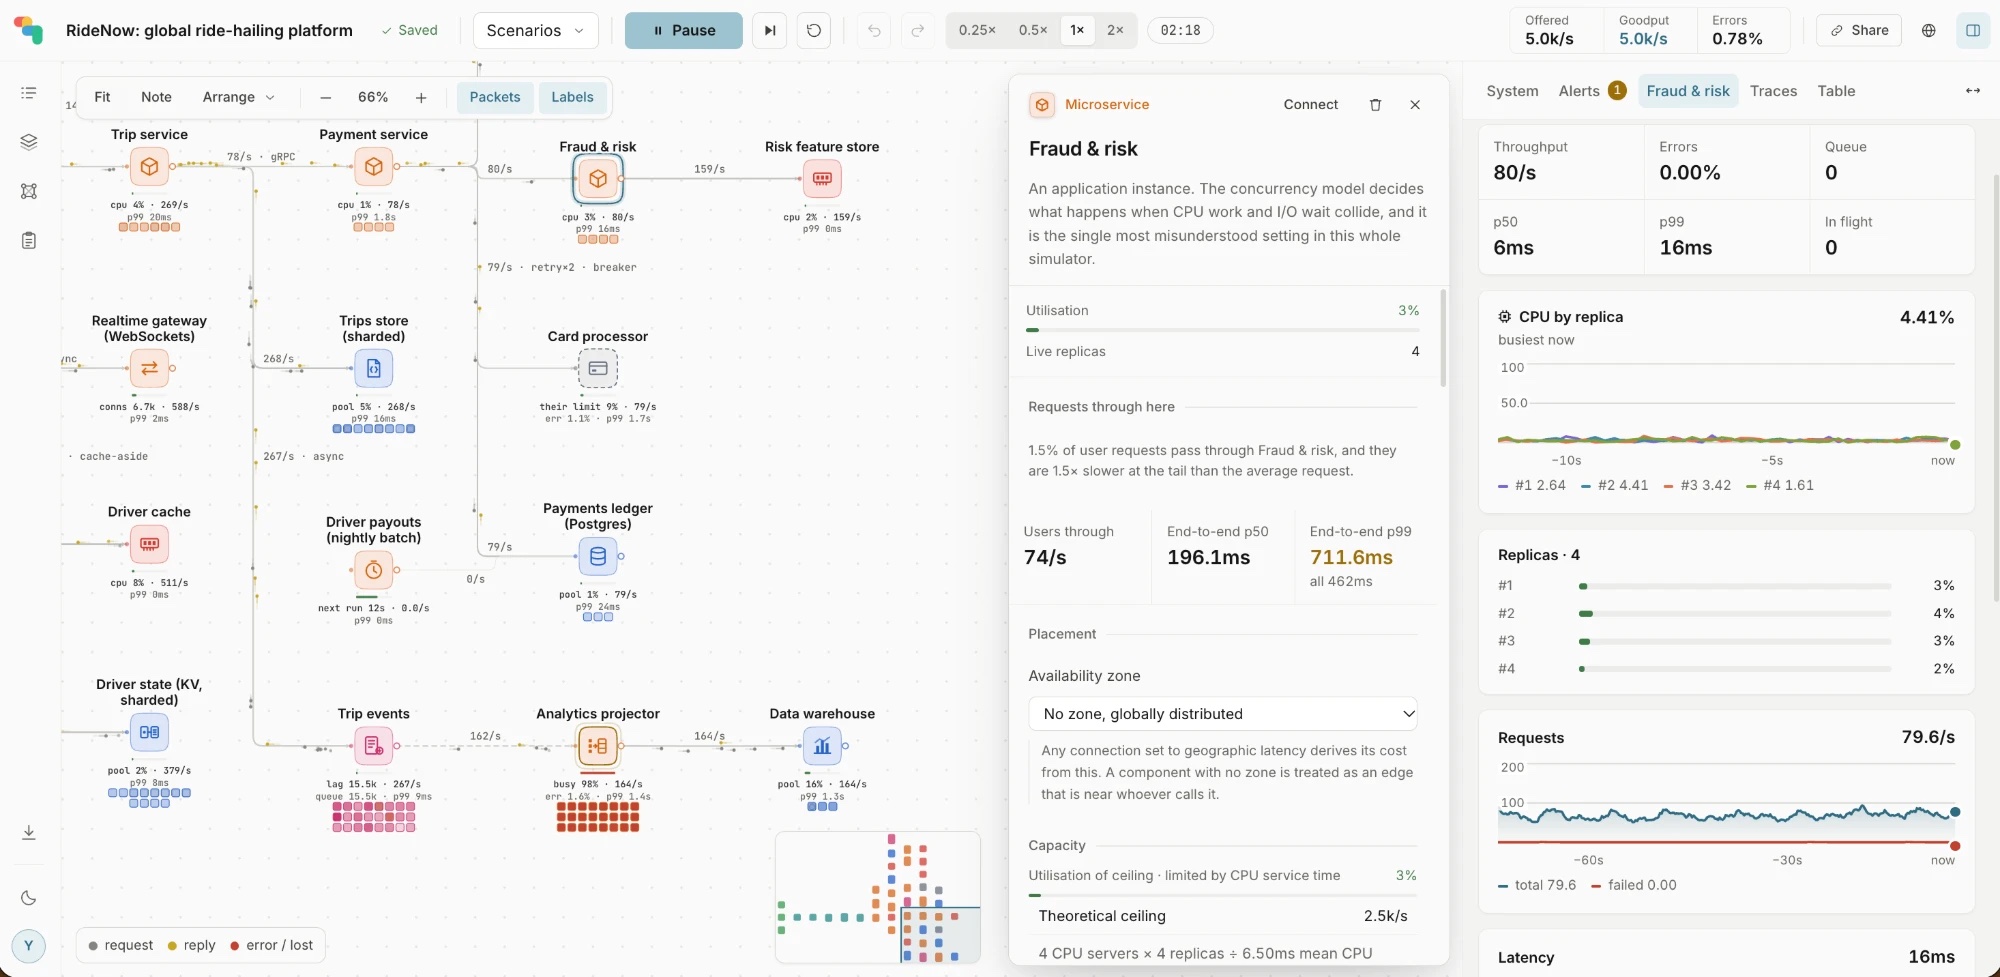
RideNow, a global ride-hailing platform at five thousand requests a second: two regions, ninety components, every line laid out without a crossing.
For AI assistants
ShardPath has an MCP server with 19 tools, for Claude, Cursor, VS Code, ChatGPT and any other MCP client. Ask for a design that handles fifty thousand requests a second, and the assistant builds it, runs it, finds the bottleneck, and answers with numbers rather than a guess.
you     Will checkout survive 5× traffic?

→ find_capacity   checkout
→ simulate        traffic ×5 · 60 s

claude  Not as it is: payments saturate first,
        at its connection pool. Doubling the
        pool and queueing the receipts keeps
it inside the SLO at 5×.Who it is for
Practise system design by watching your answer run, not by hoping it holds.
Try a design choice in minutes, a cache, a queue, another region, before the RFC.
Show a retry storm or a hot shard live, then share the design as a link.
No. It is a simulator: your design is modelled, not your code. Queues, connection pools, caches, retries and timeouts behave the way they do in real systems, with every setting yours to change, so you can see the shape of a failure before you build anything.
No. It runs in the browser, and the simulation runs on your own machine in a background thread. Nothing of your design leaves the browser unless you save it to an account.
The behaviour is faithful: how a queue grows, when a pool runs out, how retries multiply load. The absolute numbers come from the settings you give each component; change a database’s read time and the whole system answers to it.
Yes. ShardPath has an MCP server, so Claude, Cursor, VS Code and other MCP clients can build a design, run it, inject faults and read the results.
It is free during the beta. Paid plans, with more saved designs, sharing and team features, come later.
Write to hello@shardpath.com and you will get an invite as soon as the beta opens.
ShardPath opens to a first group of engineers soon.
Request early access